
Knowledge Visualization Part 3: How We See and Why It Matters

You’ve likely seen the video with gorilla—the one in which you actually missed the gorilla the first time you watched it? Selective attention is real—hence laws against texting while driving. All of us who aim to share knowledge thoughtfully (outside of cars and monkey suits) learn to develop communication habits that engage our intended audience with respect and with a clear purpose. In this third post of their series on visualization, the authors help us ground our intuitions about the right things to do by showing us examples and takeaways. — Editor
Photo by Luca Iaconelli on Unsplash
Authors: Josef Kauzlarich and Diego Velasquez
To recount where we’ve been thus far: Our first post on knowledge visualization built the case for why organizations should put significant thought into how their products will be received by their customers. The second post deconstructed some barriers individuals put up that tell themselves they are not creative or visual. With this third post, we’d like to focus on how individuals conduct visual queries by drawing your attention to three facts and their implications for your designs:
- People don’t see very much.
- When people look around, they search for patterns.
- Complexity causes cognitive disruption.
People Don’t See Very Much
In any given second, it turns out we see only about three objects in our visual field [1]. Our visual field is composed of what we might see and we are unaware of 99% or more of it. We aren’t aware of any visual detail other than where we are fixated at any instance, and we retain little of the visual data we gather. When we look across our visual field, we are typically trying to accomplish a specific task, so we block out or ignore visual data that doesn’t help us accomplish that task. Don’t believe us? We didn’t believe this at first either. But if you take a few moments to look around, you will discover many things about your environment you didn’t notice.
For example, Josef’s wife keeps a vase of fabric flowers in their bedroom. He recounts his visual journey thus:
Before this moment I always registered that there were flowers in a vase. However, I never noticed the colors of orange, pink, white, and deep red or the intricacies of how each flower shape complements the others to create something beautiful or how some of the leaves have imitation water droplets on them. I noticed these details very quickly, but I had to spend time finding them and I was trying to accomplish a specific purpose: writing an example for you, the reader! While I was looking at the flowers, I didn’t notice anything else in the room.
What can you learn from this? You must pay close attention to the amount and arrangement of information you include in your products and presentations. For example, when you see a very text-heavy or busy PowerPoint slide during a presentation, do you appreciate the busy clutter? Of course not. You are much more likely to check out mentally because you want to see a simple map that takes you from point to point–as an infographic might do. Since people can only take in a small amount of information at a time, a slide with too much information is not enlightening for the audience, but is burdensome and confusing.
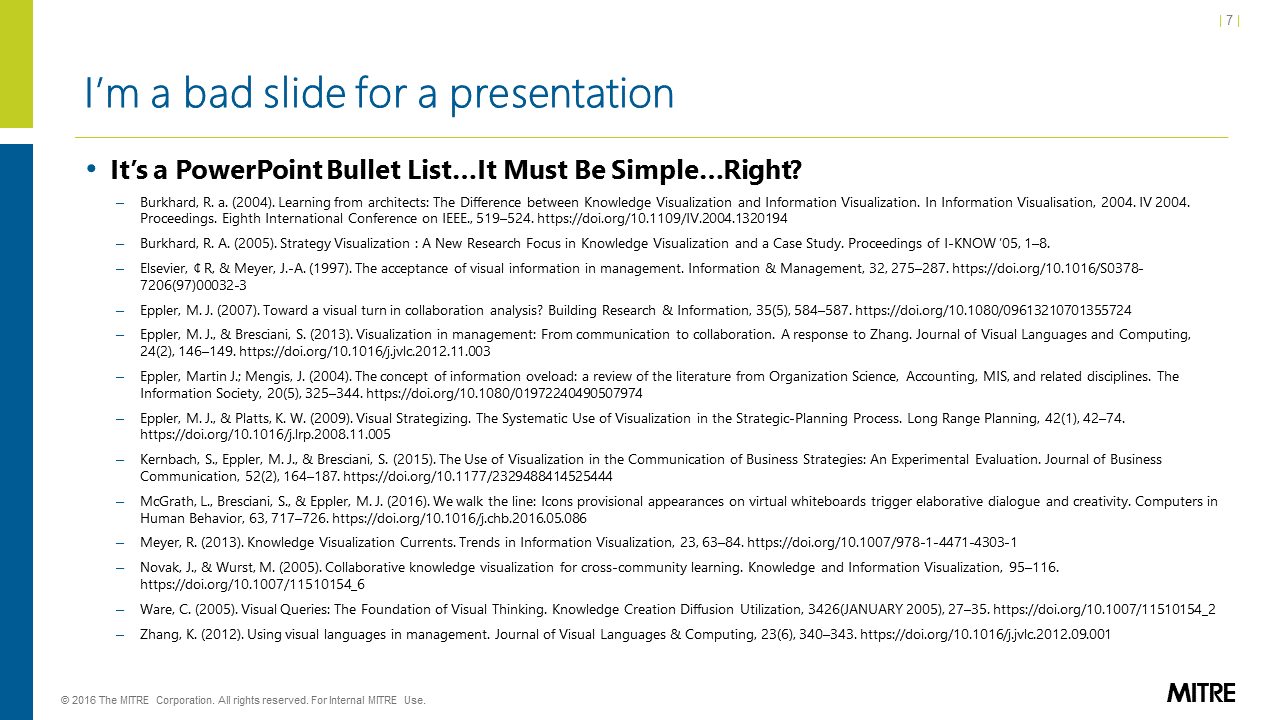
Don’t make slides like this
As a presenter, you must think not only about the information content but also how much content is needed to communicate your message, how to display the information, and the logical order in which you want people to take it in. and. Too much information at one time will lead viewers to scan all of it trying to get the point because that is the immediate problem they are solving. If they are jumping ahead to information you don’t want them to see out of context and order, they aren’t listening to you anymore.
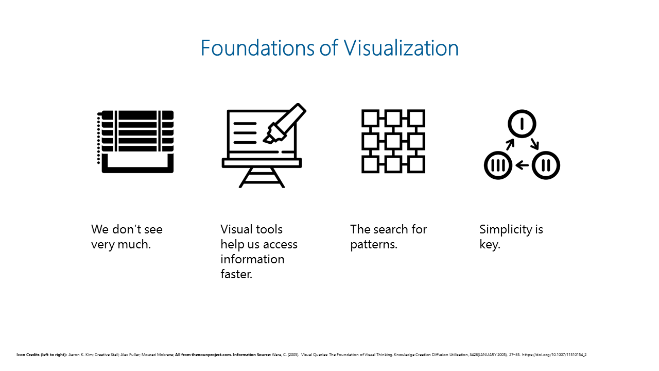
Make slides like this
Text-heavy or slides/pages filled with objects feel cluttered and overwhelming. Yet the two of us are amazed at how many people still present information this way. Faced with a mass of information, no audience stands a chance of staying in sync with the speaker or writer.
It is better to make designs that are clean and minimalistic. Good designs preserve space, which draws the eye to key elements, give clear directional paths for the information (which is naturally from left to right, top to bottom for English readers), and use visual elements that depict and reinforce the textual points.
The takeaway: Limit the amount of information that you show your audience at any one time and give them a clear path to navigate. This goes for both print and digital products. A 30-slide presentation with one point on each slide is often better than a 3-slide presentation with 10 points per slide. Similarly, a two- to four-page, well-designed document is better for the audience than a cramped one-page document that attempts to fit everything in too small a space.
When People Look Around, They Search for Patterns
When you look around, you are searching for patterns that you already recognize from your experience. What makes a pattern easy to see? Humans perceive visual information by recognizing patterns of objects based on contour, color, motion, and texture, and you store them in your visual working memory based on short fixations (100-300 milliseconds) of visual regions [1]. The patterns we seek are often focused on a problem we are trying to solve. Even something as simple as walking down a street without bumping into anyone demands that you are constantly scanning for patterns to help you accomplish the task. These patterns could include things like pedestrian crosswalk signals or some familiar landmark.
What can you learn from this? First, help your audience identify the problem you are helping them solve as they take in your message. If you leave them guessing, they are likely to leave confused or even worse, they may take away the wrong message. Explaining in some fashion—perhaps through a title (in the case of print or digital products) or a vocal cue (in the case of a presentation)—can guide the audience and can help them focus.
Your best bet is to help them focus on your message using visual cues. Graphic design is a powerful tool that can help us place emphasis where it needs to be and organize information in a way that is both logical and aesthetically pleasing. It doesn’t just make information pretty; it brings the most essential information to the forefront. Let’s look at an example:
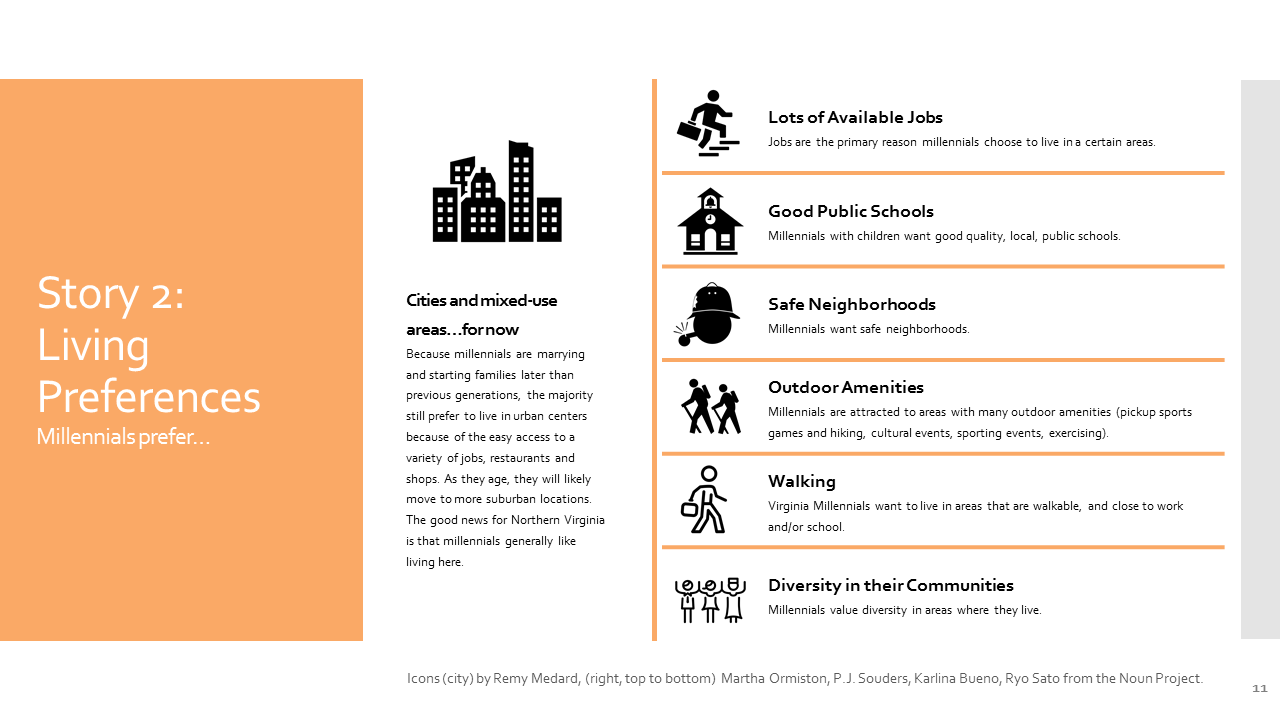
An example of using graphic design fundamentals to place emphasis on important points
This excerpt comes from a larger work on how to attract and retain millennials in the workplace. The page introduces the reader to the problem with the title, “Living Preferences: Millennials prefer…”, which naturally prompts the question, “What are the living preferences of the millennial generation?” It then answers the question, placing the factors in a logical top-to-bottom order.
The takeaway: Give the reader a clear problem statement that prompts a question that you then answer. Then use graphics to make your answers easy to understand and remember.
Complexity Causes Cognitive Disruption
We noted earlier that a 30-slide presentation with one point per slide is better than a 3-slide presentation with 10 points. This is true, but be wary of another truth. Cognitive disruption can occur when information is presented in an overly complex way, even if it is visual [1]. For example, during that presentation of 30 slides, the screen would constantly be changing. This movement could make it very hard for your audience to connect the dots between points and miss the larger picture you might be trying to paint. The same goes for print or digital information. If information isn’t presented in a manner that inspires connection between points to tell a story, then your audience can miss it.
One additional point is the reality that visuals are information themselves. We’ve seen people “visualize” by slapping an image into their presentation or document at various points. What they fail to realize is that it isn’t helpful to add images or other visual elements unless they enhance or reinforce the meaning of your message. If the message and the visual don’t come together in a cohesive manner, then the product becomes needlessly complex.
What can you learn from this? By keeping your visuals as simple and minimalistic as possible, you decrease the cognitive load for the audience trying to understand your work. Continuing with our example, you should reconsider whether 30 slides or a 5-page document is the best channel for conveying your information and consider other alternatives (e.g., poster, visual database), all while adhering to graphic design principles (e.g., ensuring sufficient white space). If you think there is value in being able to access similar information in close proximity, don’t spread it out across pages. You must find the balance between complexity and keeping information at hand.
The takeaway: Complexity is a very real part of modern life. Your job is to make sure your message doesn’t add to that complexity. Keep your designs simple, minimalistic, and logical to reduce the cognitive cost of understanding them.
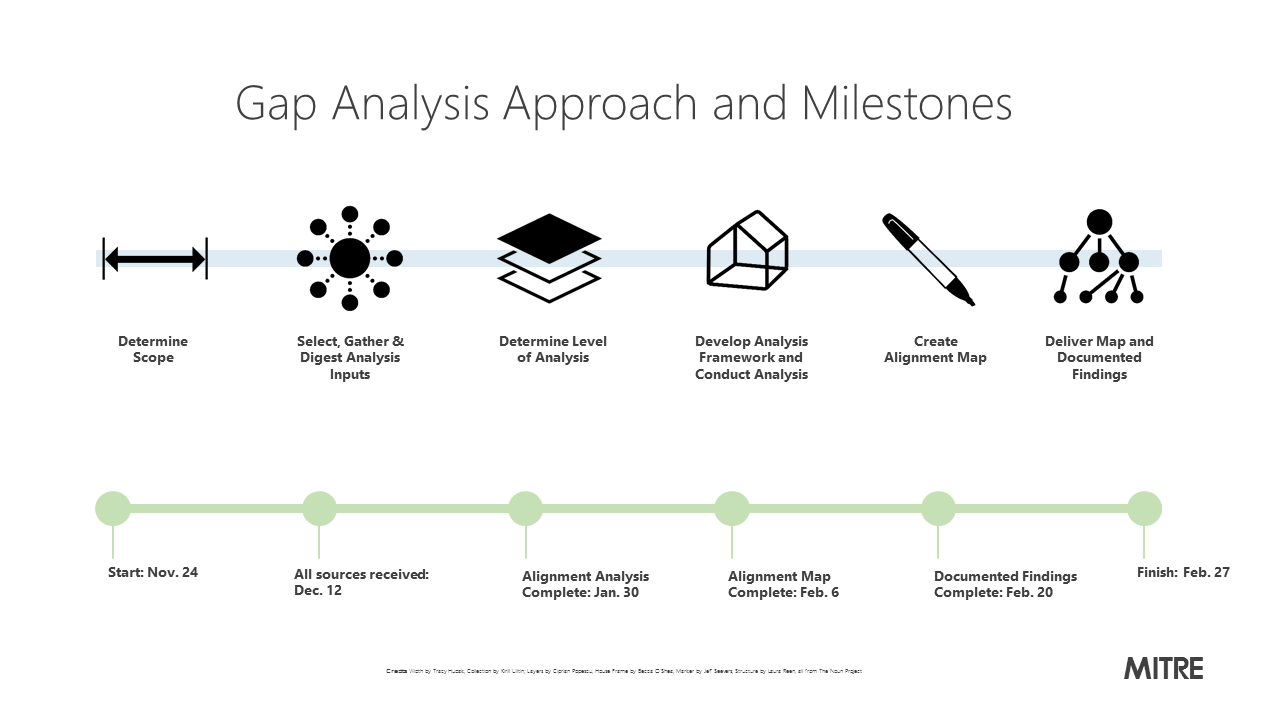
Example of a document graphic that simplifies a complex message
Be on the lookout for our final post, which will focus on easy tips to improve nearly any design.
Josef Kauzlarich is a Business Strategist at The MITRE Corporation who specializes in knowledge visualization. He has a Master’s Degree in Business Administration from the University of Maryland University College. He is a certified Strategic Planning Professional with the Association for Strategic Planning. Prior to joining MITRE, Josef worked in business marketing.
Diego Velasquez is a Business Strategist at The MITRE Corporation who specializes in knowledge visualization. He has a Master’s Degree in Business Administration from George Mason University. He is a certified Strategic Planning Professional with the Association for Strategic Planning. Prior to joining MITRE, Diego worked in the financial services industry in a variety of positions, including branch manager, loan officer, and loan modifier.
Source
[1] Ware C. (2005). Visual Queries: The Foundation of Visual Thinking. In Tergan SO., Keller T. (Eds), Knowledge and Information Visualization. Lecture Notes in Computer Science, 3426, 22-35. Berlin: Springer, https://doi.org/10.1007/11510154_2
See also:
Knowledge Visualization Part I: Recognizing the Value of Empathic Delivery
Knowledge Visualization Part 2: Awakening Your Sleeping Artist
© 2017 The MITRE Corporation. All rights reserved. Approved for public release; distribution unlimited. Case number 17-4188
The MITRE Corporation is a not-for-profit organization that operates research and development centers sponsored by the federal government. Learn more about MITRE.
0 Comments