
Using Immersive Visualization to Make Strategic Choices
Cognitive assistance isn’t mainstream yet, but decision support tools that enable decision-makers to understand tradeoffs in multiple dimensions are available. Shawn Chin and Rick Haberlin, who built one such tool, make the case that “engagement requires visualization as well as words, so effective tools will simultaneously manage collective knowledge and display it as imagery that is intuitively attractive.” —Editor
Authors: Shawn Chin and Dr. Rick Haberlin
Decisions in the government are often made without the benefit of understanding second order effects caused by complex relationships. Yet, as government agencies face unprecedented pressure on their mission and budgets, their leaders face questions such as:
- Am I within my overall budget authorization?
- What is the mission risk associated with my decision?
- What programs are paying the bills for my new technology?
- Will my decision reduce operating costs?
- What geographic areas (Congressional districts) are affected by my decision?
- How will my decision impact other organizations?
What leadership has lacked up until now are decision support tools that enable them to understand tradeoffs in multiple dimensions when making decisions. Today, engagement requires visualization as well as words, so effective tools will simultaneously manage collective knowledge and display it as imagery that is intuitively attractive—customized maps, virtual environments, heat maps, and classic graphical displays. 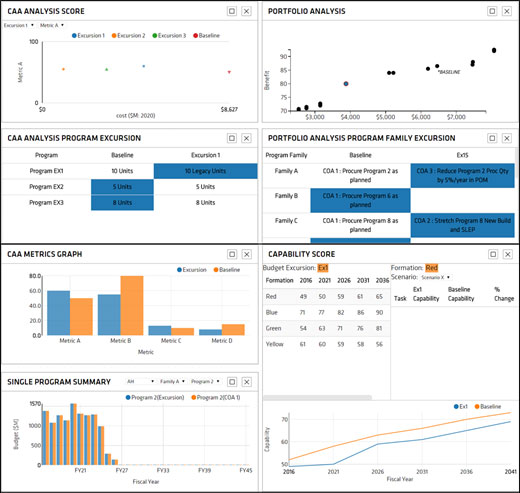
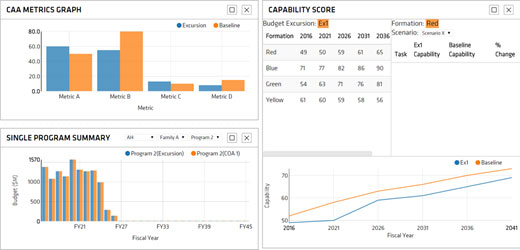
Figure 1. Immersive Visualization display.
A team of MITRE researchers met this need by building an interactive, immersive visualization environment that facilitates strategic decision-making and better informs decisions about how to spend limited resources. Our interactive environment—we call it a Decision Environment—enables decision makers to collaborate in real time, even when they are working remotely. It is built on several leading-edge web technologies including MongoDB, Express.js, Angular.js, Node.js, D3.js and Socket.io, making the capability accessible from any device with a JavaScript-enabled web browser regardless of location or operating system.
At MITRE’s McLean campus, Immersive Visualization will be an integral part of the Simulation Experimentation and Analytics Lab, an engaging environment for high-level decision makers and their support staffs to interact with a wide variety of analytics, operating at multiple levels of resolution and fidelity in real time. As of this writing, our research extends a Planning, Programming, Budgeting and Execution visualization capability that we prototyped in FY15. Ultimately, this project will allow strategic decision makers within the government to arrive at allocations that better align with strategic goals and with greater transparency. By the end of 2016, Immersive Visualization will incorporate high-fidelity linkages among views and implements back-end simulations. A reusable Course of Action comparison framework will enable rapid customization support for emerging strategic questions.
Figure 2 highlights some of the existing views. 
Figure 2. Multiple Immersive Visualization views.
In 2015, the project team developed an architecture and working prototype for a flexible, adaptive environment using web standards and frameworks built upon a MEAN (MongoDB, Express.js, Angular.js, Node.js) technology stack. The environment can be run on any operating system, spread across geographically dispersed participants. To get this far, we worked closely with a MITRE colleague supporting the Department of Defense (DoD), examining existing modes of interaction with data visualization. The result was a best-of-breed implementation that gives our sponsors the perspective they need across their portfolios. Here’s a peek at a notional Pareto curve illustrating a cost-benefit analysis of budget vs. capability (see Figure 3). 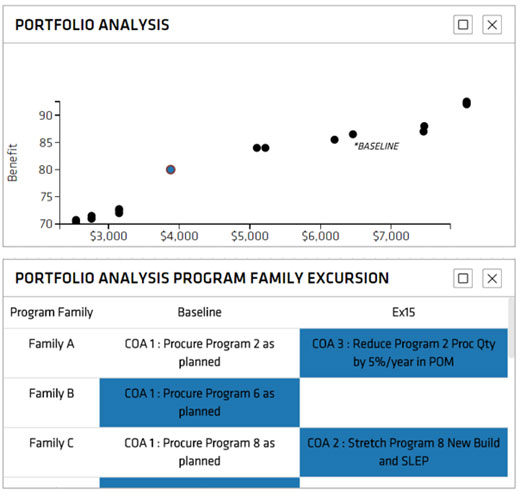
Figure 3. Portfolio analysis view for cost-benefit analysis.
To provide realistic visualizations, the DoD budget was represented at a high level of detail. The effort culminated in a working concept demonstration of an interactive, multi-view budget allocation environment based on a scripted user story of a customer use case. In FY16, our team will add simulation capabilities and improve user experience. As government sponsors immerse themselves in the prototype, interest is growing. This spring and summer, we’ll be demonstrating our prototype to multiple government agencies and installing the tool for a senior DoD decision-maker and his team.
Is your organization awash in data? Perhaps Immersive Visualization holds the key to better understanding.
0 Comments